
 English
77262
 Quantification is about making friends with time I am Haili. I have been focusing on quantitative development for many years. I can be an agent or OEM for digital currency, gold foreign exchange, futures and crude oil, etc. If you want to cuddle up for warmth, or if you have any questions or need consultation, please feel free to send us a private message! WeChat:bosen-haili Call:191-6773-9294 Thank you very much for your [like + follow] @博胜科技海里  Solana's SOL has fallen 38% over the past 30 days, hitting a two-year low of $67 on Friday. Many analysts said that the decline of this cryptocurrency, which ranks seventh in market capitalization, is not over yet, and the target can be as low as $30. Key points:
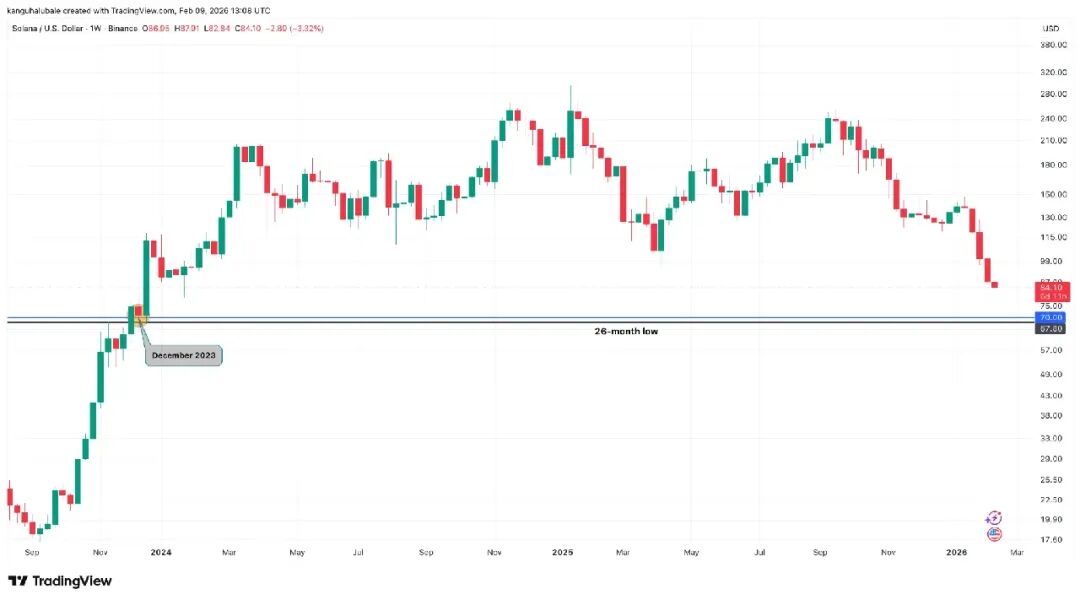 SOL targets $42 after bearish confirmationSOL prices have fallen by more than 72% since the cycle high of about $295 in January 2025. In the process, its price confirmed a head and shoulders (H&S) pattern on multiple time frames. Crypto analyst Bitcoinsensus shared a chart showing SOL confirming the H&S pattern, suggesting there is still room for the downside. “SOL has confirmed a breakout from this macro head and shoulders pattern,” Bitcoinsensus posted on X on Monday, adding: “The price target could be as low as $50 per SOL. 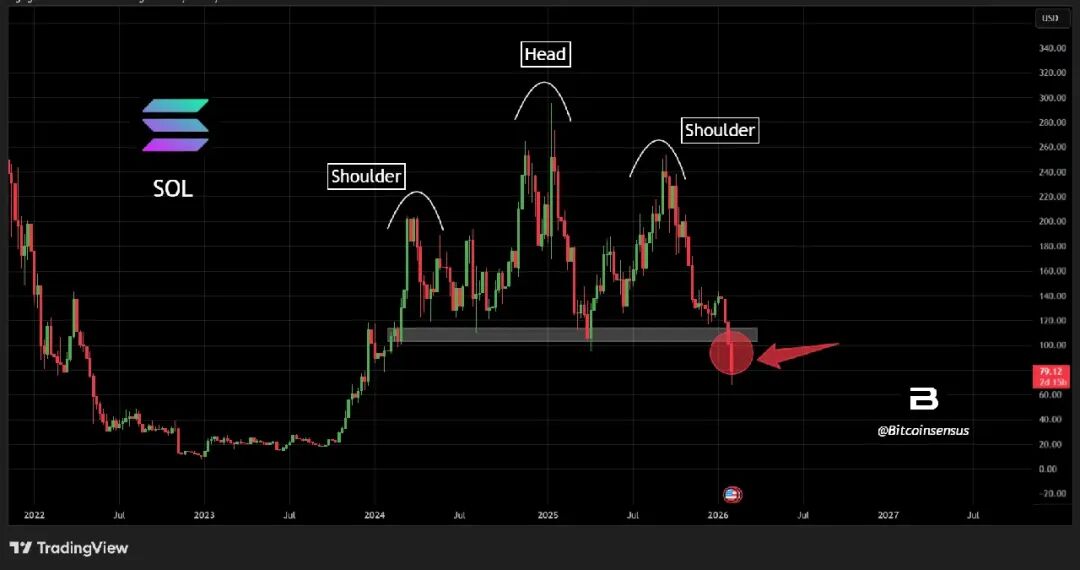 “This is a classic head and shoulders pattern with a calculated moving target of $45,” said analyst Nextiscrypto, referring to SOL’s two-week candlestick. But other analysts believe prices could fall even lower. The pseudonymous analyst "Shitpoastin" pointed out that Solana's price has formed a monthly-level "large head and shoulders" pattern in the past two years. "The support below reaches the $30 line, and there is no real support for the time being." ” 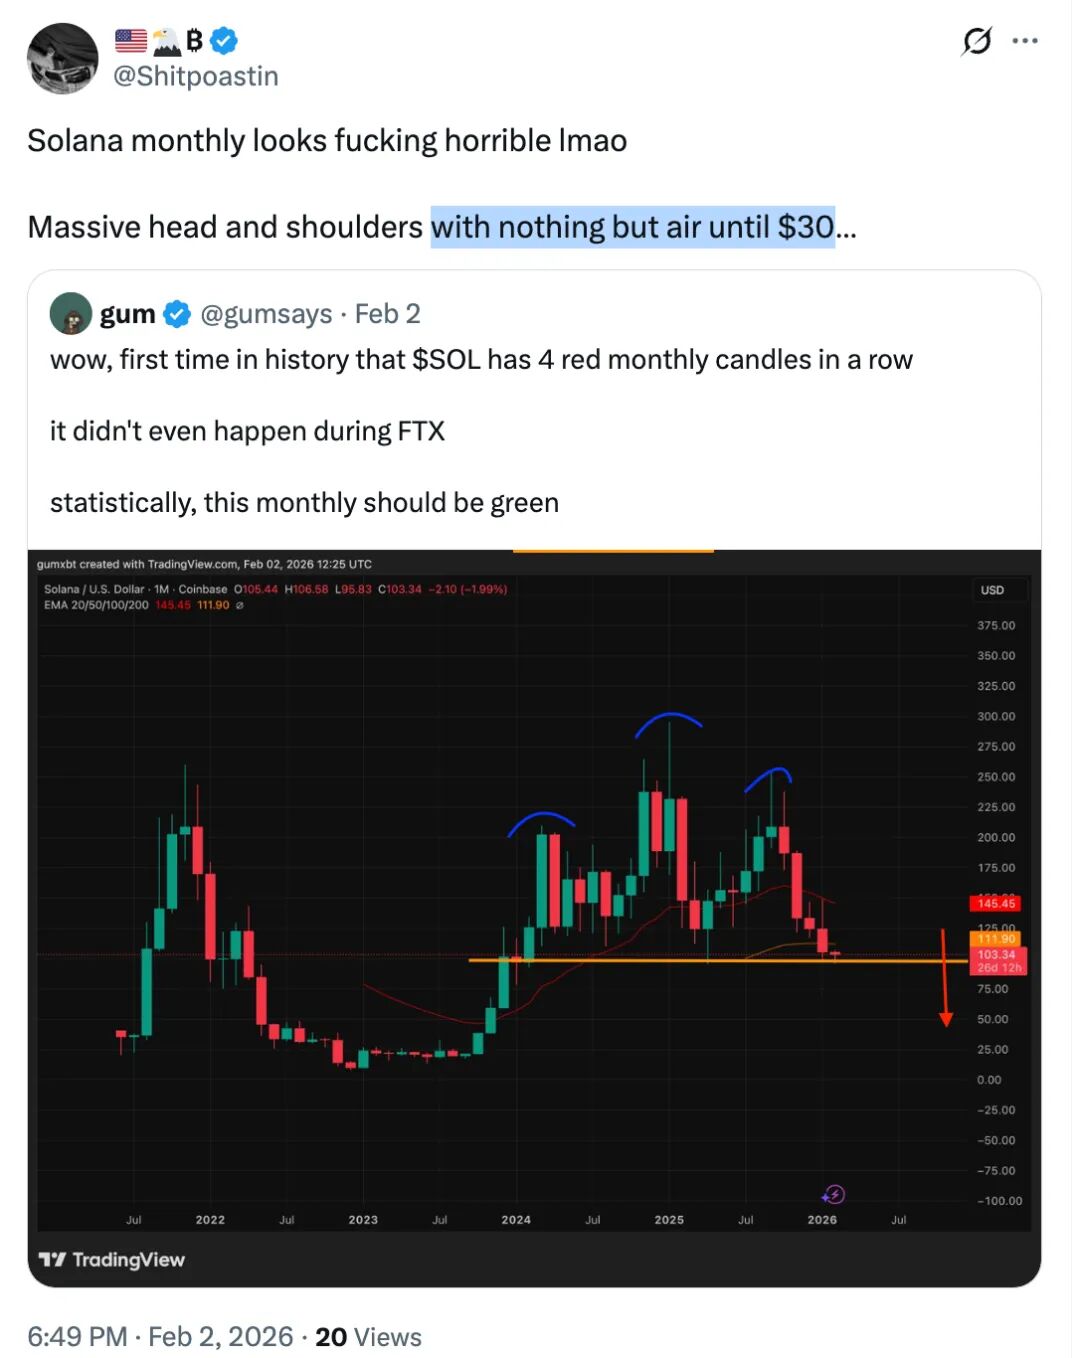 At the same time, the K-line on the second day shows that the SOL price has fallen below the H&S neckline of $120 on January 30. 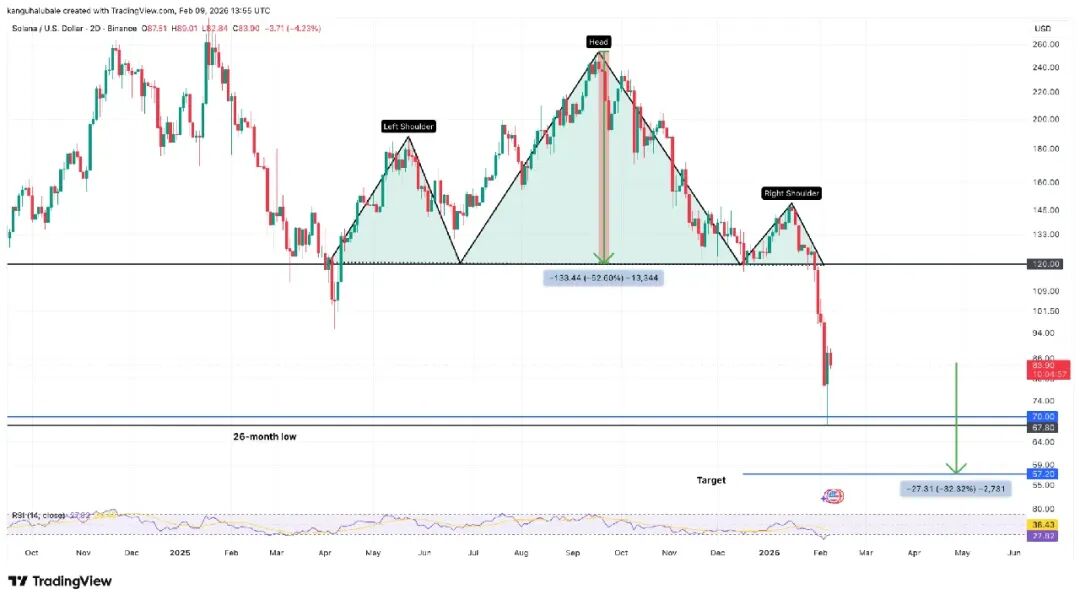 The H&S pattern’s calculated target (distance from the break plus the height of the top) is $57, implying a 32% decline from current levels. SOL’s MVRV Band Provides Hope for $75 BottomWhen SOL plunged last week, it was supported by the lowest boundary of its market value to realized value (MVRV) extreme deviation pricing band, which is currently at $75. These bands show the range when the SOL price was below or above the average price of the last time traders moved their coin. 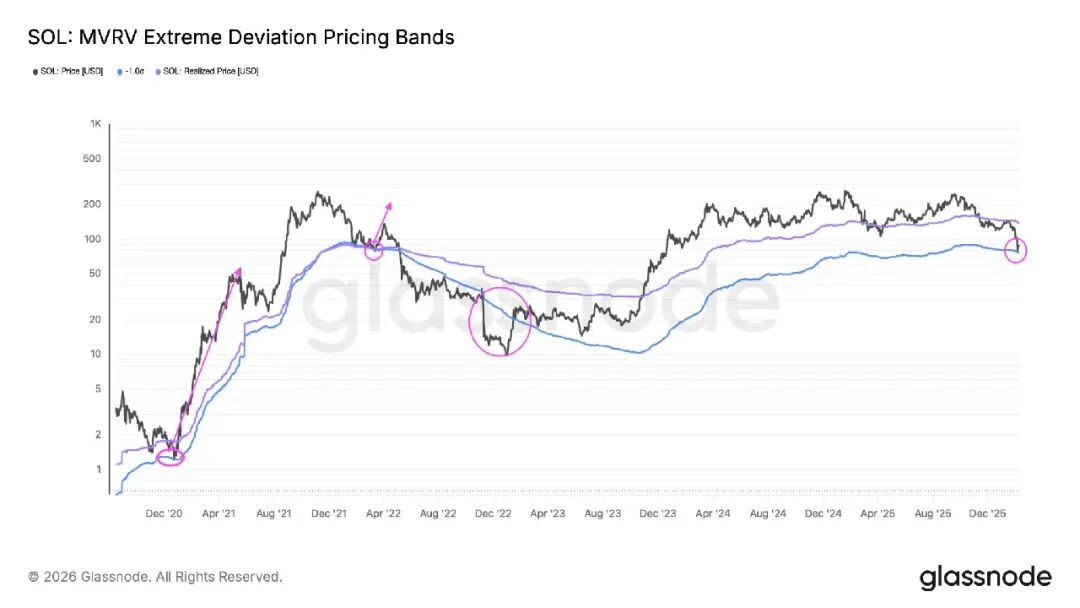 Historically, SOL prices tend to drop to levels near the lowest MVRV band or even lower before bottoming out. This includes March 2022, when SOL price tested the lowest MVRV of $75 and then rebounded 87% to $140 in three weeks after deviating from the band. A similar recovery also occurred in December 2020. However, SOL, which was associated with the FTX crash in November 2022, fell sharply below this band. In December of that year, the price fell by 70%, finally bottoming out near $7. Therefore, if SOL falls below $75, it may trigger the next correction like in 2022, consistent with the head and shoulders target. Risk warning: The above content is for reference only and is intended to disseminate more information. It does not constitute any investment advice. Be sure to increase your risk awareness. QuantifyTrading artifact  What is quantitative trading? Quantitative trading refers to using advanced mathematical models to replace human subjective judgments, using computer technology to select various "high probability" events that can bring excess returns from huge historical data to formulate strategies, which greatly reduces the impact of investor sentiment fluctuations and avoids making irrational investment decisions when the market is extremely fanatical or pessimistic.  The FA foreign exchange robot was officially launched in May 2018 and the strongest version of FA4.0 was officially released in March 2023. It breaks through the limitations of the original single foreign exchange market and expands into major global markets such as energy, precious metals, digital currencies, US stocks, and A-shares. It offers a variety of innovative gameplay, free trading, and new financial opportunities.  Feature highlights about FA robots 1. Supports all MT5 trading currency pairs, gold/crude oil/foreign exchange/futures stock index, etc. 2. Core big data algorithms and numerous quantitative indicators, the perfect combination of machines and artificial intelligence 3. Millisecond-level transaction speed, never miss any band, calmly face all kinds of extreme market conditions 4. The cloud server automatically receives the signal source and determines the currency pair and long and short direction suitable for placing orders. 5. Built-in news system independently developed by Berson team to avoid news in advance and stay away from risks 6. Multiple take-profit strategies, grid take-profit, overall take-profit, and random orders can be linked to take-profit and stop-loss 7. Under unilateral favorable market conditions, by tracking the take profit, the single take profit amount can be maximized. 8. In the case of large reverse market fluctuations, by tracking and opening positions, the interval between replenishment orders can be maximized. 9. Various trading parameter settings and multiple mechanism execution to adapt to users’ different risk and position needs 10. Multiple order-making strategies, gold long and short, foreign exchange signal source, crude oil arbitrage, 24-hour capture of fluctuations Automatically place orders and close positions according to the strategy, without any manual intervention. The profit guarantee is combined with automatic risk control, which is stable, flexible and non-stop 24 hours a day.   How to use Quantitative Robot? Follow the WeChat public account "Bosen Haili Quantification" and communicate with customer service online Add WeChat ID: bosen-haili Call the service hotline: 191-6773-9294 ✦ Company address: 1611 Berson Technology, Building A3, Poly Daduhui, Panyu District, Guangzhou City, Guangdong Province (Exit G of Hanxi Changlong Subway Station, go straight through the traffic lights for 300 meters) Berson Technology Intelligent Quantitative Robot Created with years of experience in Internet products Interaction is more humane Operation is simpler and faster Make your investment life more convenient!  bosen-haili CHAJI0924 Video number Berson Technology Haili-Quantification Berson Quantitative System Intelligent Trading |

|

|

|

|

|