
 English
16999
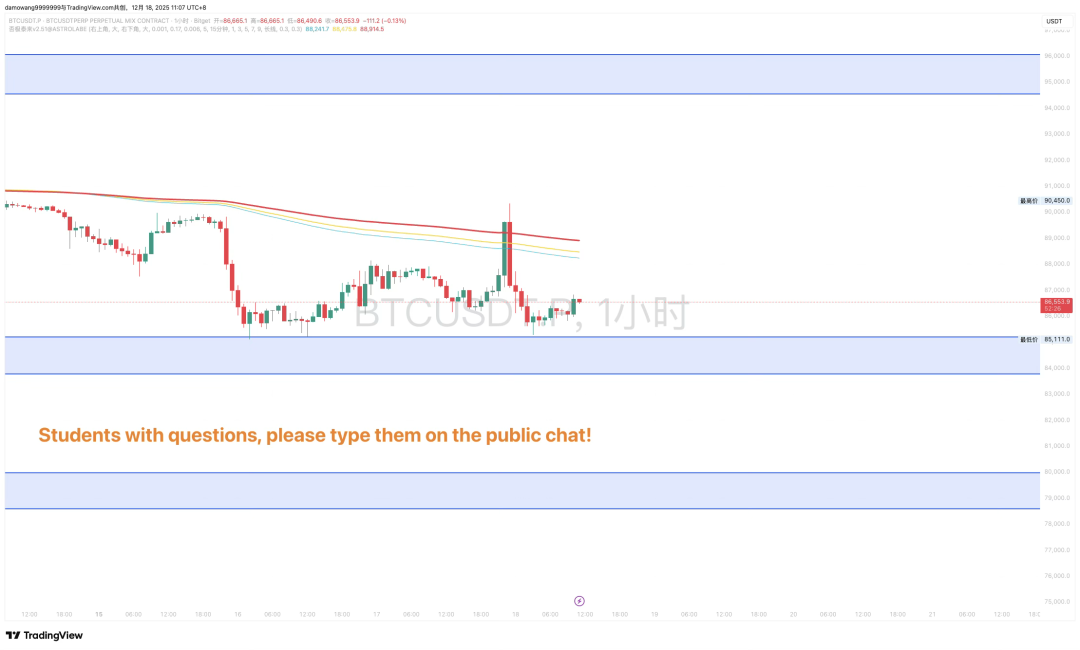
 (Today’s market analysis) Today's market analysis 2025.12.18  BTC Current price: $86485.45  Intraday analysis 1️⃣ Structural interpretation The current price is testing the 85,000 area again. The current decline is driven by continued spot selling rather than high-leverage liquidation. This "slow bleeding" model is more difficult to reverse than a rapid decline. 84000 entity broke through, and the current maximum depth of decline is 77500. 2️⃣ Capital flow & on-chain & exchange dynamics
3️⃣ Ideas for placing orders within the day Don’t go long in the short term before reaching 90,000. If there is an obvious stagflation K-line combination (such as double top, bearish engulfing) in this area between 95000 and 96000, and we find a weak situation, we can consider shorting. The stop loss of 96,000 is physically broken, near 85,000. If 96000 breaks through strongly, we will look at 102000 above. Only when a strong bullish reversal pattern (such as morning star, bullish engulfing) appears near 84500-83800 on the hourly chart, and the trading volume is significantly enlarged, can a technical rebound in a very small position game be considered. On the downside, focus on around 80,000, or even 77,500. 4️⃣ Risk warning
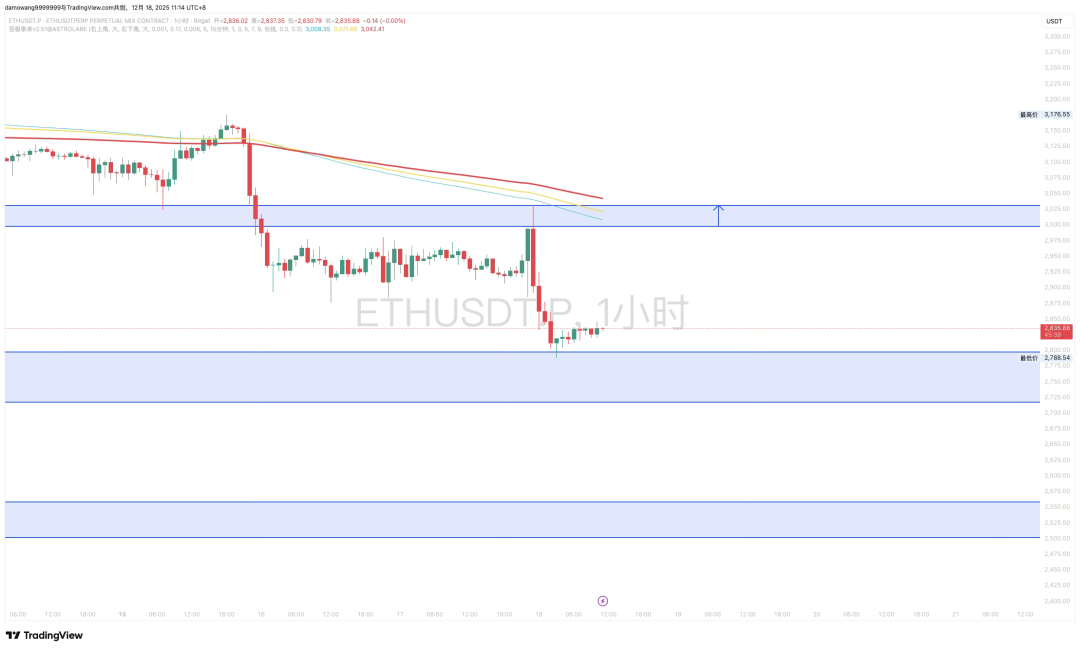
 [For reference only, not as investment advice] 🎁Limited benefits🎁 - Trader Monitor - A counterattack opportunity for ordinary people! Achieve stable income of $100-500 per day ✅Copy the strategies of professional traders ✅Realize 7x24 hours fully automatic order tracking ✅Instant push messages from domestic and overseas platforms   To give back to fans for their support Now offering [3-day free signal experience] We believe that good tools speak for themselves! Only [38 people] users who add assistants Once the quota is exhausted, the entrance will be closed immediately! Scan the code to get it now! 👇🏻   ETH Current price: $2826.53 Intraday analysis 1️⃣ Structural interpretation The trend of ETH "shows its weakness and keeps falling." The price not only fell below 2915, but also led the entire cryptocurrency market lower, showing its current extremely weak state. Fortunately, the target of 2800 has finally been reached. 2️⃣ Capital flow & on-chain & exchange dynamics
3️⃣ Ideas for placing orders within the day Weak varieties, only empty but not many. Before regaining its position and standing firmly at 3,000, one should not have any illusions about its rebound. The intraday rebound should not exceed 3000, and the next operating space should be 2720-2800-3000-3030. In the absence of an upper or lower position break, priority is given to selling high and buying low, but you need to be cautious when buying low. We are temporarily looking for a rebound during the day. In the current environment, any behavior of "buying the dip" in ETH is extremely risky, and this idea must be completely abandoned. 4️⃣ Risk warning
 [For reference only, not as investment advice] Live open classes every night from 20:30 to 22:30 From chaos to stability, use rules to grasp trends WeChat ID丨AST-FengS Bilibili丨Fengshen Chats about Trading YouTube丨Fengshen talks about trading Open Sesame丨ASTROLABE Disclaimer: The above analysis only represents the personal views of Mr. Fengshen and does not constitute specific operational recommendations. If you operate based on this, you are responsible for your profits and losses. Investments are risky and you need to be cautious when entering the market.  Like collect share ⬇️Click "Read the original text" in the lower left corner to join the ASTROLABE community |

|

|

|

|

|