
 English
19090
|
The flight conditions are changing rapidly, and the specific entry and exit positions are determined based on the real-time flight conditions. Just follow the trend if the position is broken! No matter how confident you are, please strictly implement the stop-profit and stop-loss strategy! That’s all for today! Follow me and I will help you penetrate the fog of the currency circle and seize the bull market’s magic coin! Solana (SOL) shares extended their gains, breaking above $140 on Friday after the stock rebounded from key support the previous day. Institutional demand continues to strengthen, with the SOL spot exchange-traded fund (ETF) recording more than $41 million in inflows so far this week. On the technical front, bulls remain in control with price targets above $160.  Institutional demand for Solana continues to strengthenInstitutional demand for Solana remains strong so far this week. SoSoValue data shows that as of Thursday, the Solana spot ETF recorded a weekly net inflow of $41.08 million, setting the highest weekly inflow since mid-December and continuing the weekly net inflow momentum since its launch on October 28. Additionally, total net assets of the Solana ETF have reached $1.1 billion so far this week, indicating continued rising institutional demand. If capital inflows continue and intensify, SOL prices may rise. 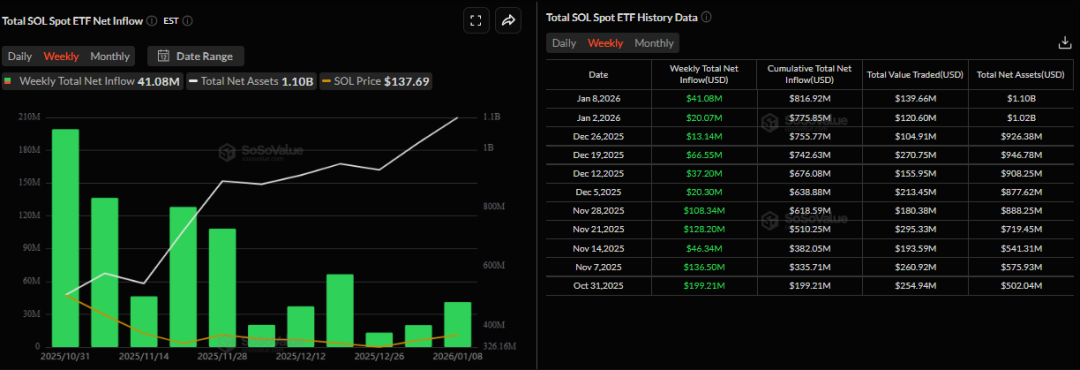 Some other signs of optimismOn Wednesday, Morgan Stanley announced that it had filed S-1 registration statements for spot Bitcoin and Solana ETFs with the U.S. Securities and Exchange Commission (SEC), underscoring the growing interest of Wall Street investors. If approved, this would signal a positive long-term future for Solana, as these ETFs would have a positive impact on SOL by allowing investors to gain exposure without directly holding it, while also increasing liquidity, legitimacy, and overall adoption. During the same period, Frontier Stable Token (FRNT) issued by the Wyoming Stable Token Committee, the first stablecoin issued by a U.S. state government, was officially launched on the Solana network, highlighting the institution's growing trust in Solana's infrastructure. 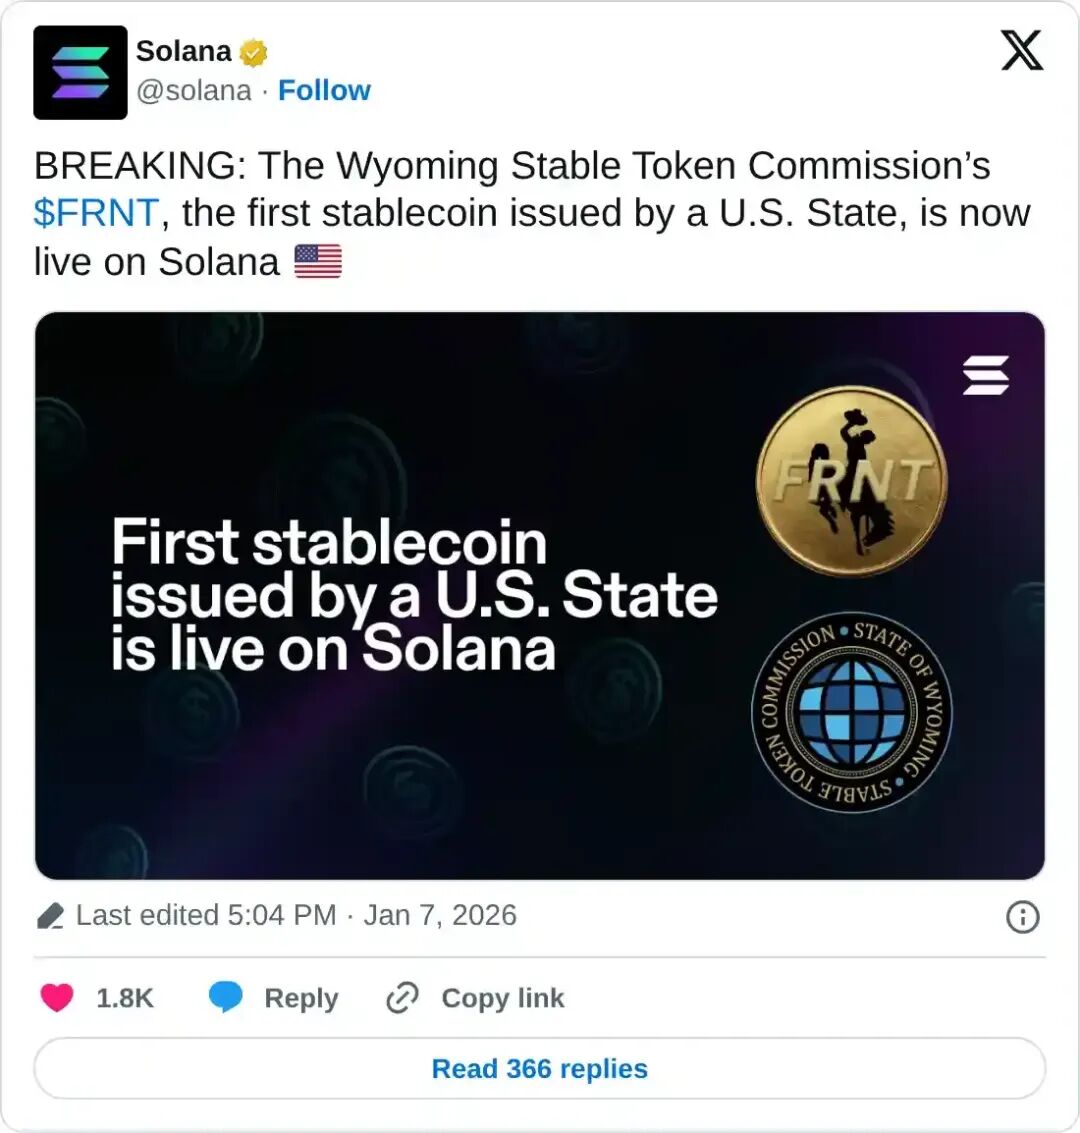 Solana Price Forecast: SOL bounces back after retesting key supportSolana price closed above weekly resistance at $126.65 on January 2 and rose nearly 12% over the next five trading days to end the week at $136.75, above the 50-day exponential moving average (EMA). However, SOL price declined slightly on Tuesday, tested the 50-day EMA again, and rebounded the next day. As of Friday, SOL was trading above $139. If SOL continues to rise, the rally could extend to the next daily resistance at $160. The relative strength index (RSI) on the daily chart is at 61, which is above the neutral level of 50, indicating that bull momentum is building. Furthermore, the Moving Average Convergence/Divergence indicator (MACD) shows a golden cross and the green histogram breaks above the neutral level, further supporting the bullish view. 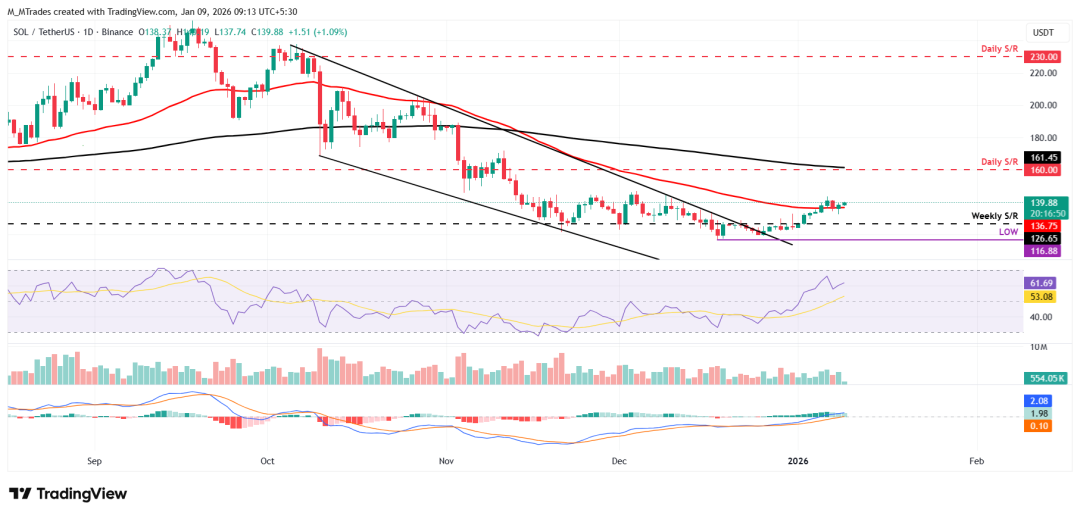 However, if SOL pulls back, it could continue its decline towards the 50-day moving average near $136.75. The flight conditions are changing rapidly, and the specific entry and exit positions are determined based on the real-time flight conditions. Just follow the trend if the position is broken! No matter how confident you are, please strictly implement the stop-profit and stop-loss strategy! That’s all for today! Follow me and I will help you penetrate the fog of the currency circle and seize the bull market’s magic coin! |

|

|

|

|

|