
 English
78492
When the price penetrated 2910, the entire Ethereum ecosystem held its breath. This is not a technical correction, but a test of faith. 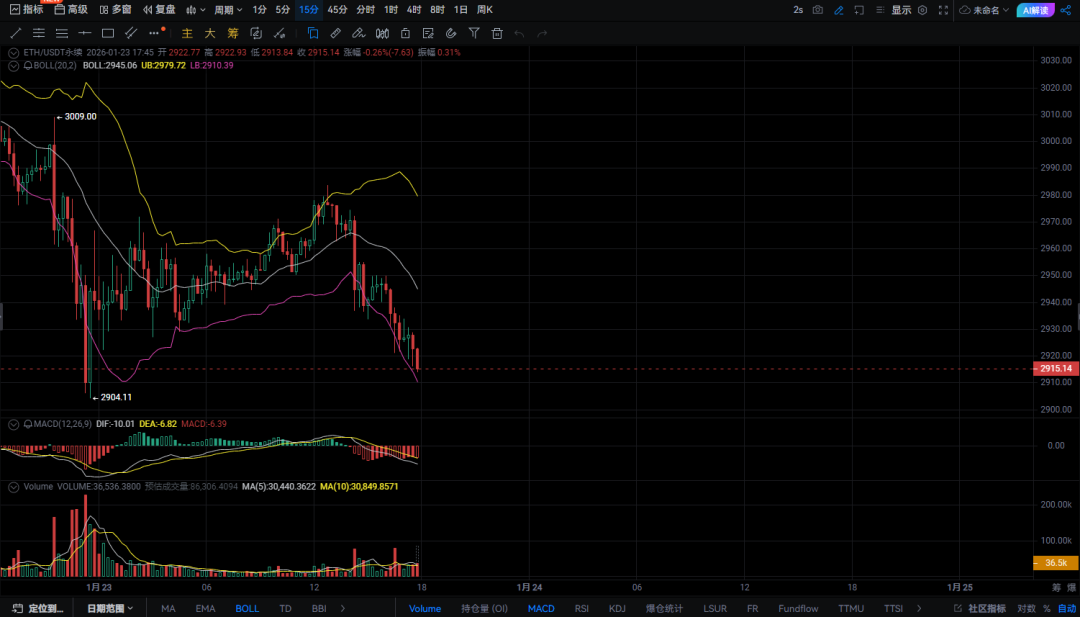 According to the latest K-line data, ETH is currently at 2915.14, with the intraday amplitude compressed to 0.31%, and the trading volume reaching 36.53 million lots. This price has accurately pierced the lower track of the Bollinger Bands at 2910.39, and the market is standing on the edge of a technical cliff. 1 Real-time disk: technical indicators are in critical condition across the board The situation is more serious than expected. Not only did the price fall below the psychological 3000 mark, it is now below all key moving average systems. The Bollinger Band indicator sends a strong signal: the middle track 2945.06 has been transformed into strong resistance, the upper track 2979.72 is out of reach, and the lower track 2910.39 is being tested repeatedly. Once the body closes below this level, a channel will open to the 2850-2880 area. The MACD indicators are in a standard short position arrangement: DIF value -10.01, DEA value -6.82, MACD column -6.39 and green, showing that the downward momentum is still being released, and it is difficult to say a bottom in the short term. Trading volume was relatively active (36.53 million lots), but it was mainly selling pressure. The price fluctuates within a narrow range around 2920, and the long and short parties are engaged in a subtle game here - is this the calm before the storm, or a precursor to a bottom? 2 Key price levels: The life and death line for long and short has been drawn The current market has entered an extremely sensitive area, and several key price points determine the market outlook: First line of defense: 2910. This is the position where the lower track of the Bollinger Bands coincides with the early small platform. If the daily closing position is above this position, there may be a technical pullback to the 2940-2950 range in the short term. The dividing line between life and death: 2880. This is the low point area in December 2025. Once it falls, it will confirm the continuation of the mid-term downward trend, and the support below will directly reach the 2800 integer mark. Short target: 2772-2800. This is the cost area for large purchases in the early days of ETH spot ETF listing, and it is also a strategic location that bulls must defend. The resistance above is clearly visible: 2945 (middle track of Bollinger Bands) → 2980 (previous low platform) → 3000 (psychological mark). Each upward step consumes a lot of buying power. 3 Undercurrents on the chain: the silence and actions of giant whales Despite the pessimism on the market, there are still mysteries hidden in the data on the chain. The current queue of ETH waiting for pledge is still as high as 2.6 million, worth about 7.5 billion at current prices, which is basically the same as the previous day's data. what does that mean? After the price fell below 3,000, the number of ETH queued up for pledge did not decrease significantly. The validator exit queue continues to remain at extremely low levels, indicating that long-term holders have not panicked and left the market. Tom Lee's BitMine company increased its pledged position again yesterday. Although the specific number has not been disclosed, this type of institutional behavior shows that professional investors are taking advantage of the decline to accumulate chips. What’s more noteworthy is that the number of daily new addresses on the Ethereum network remains stable. Although the lock-up value of DeFi has declined, the proportion of core protocol TVL has increased instead. When the market panics, funds flow to the most resistant high-quality protocols. 4 The Emotional Cycle: Where Are We at? Judging by market sentiment, we may be experiencing the early stages of a “desperation phase.” The fear and greed index has entered the extreme fear range, and extreme remarks about "ETH returning to zero" have begun to appear on social media. Historical experience shows that when the most determined holders begin to doubt, the bottom is often not far away. But what's different this time? The macro environment is more complex: expectations of tighter global liquidity have intensified, and traditional risk assets are also under pressure. At the regulatory level, the delayed review of the U.S. encryption bill has increased policy uncertainty. These factors prolong the bottoming time and make the rebound more difficult. Technical aspects show that this adjustment may take the path of "time for space": repeated shocks and bottoming in the 2900-3000 range, consuming the power of shorts, rather than a V-shaped reversal. 5 Operation Strategy: Rational Choice on the Edge of the Cliff Facing the current market situation, different investors should adopt differentiated strategies: Short-term traders: focus on the 2910-2945 range. If the price rebounds to 2940-2945 (the middle track of the Bollinger Bands) and falls back when encountering resistance, you can test short position and stop loss above 2955. ; If the price falls below 2910 due to heavy volume, do not rush to buy the bottom and wait for the signal of stabilization near 2880. Mid-line investors: You can start building positions in batches in the 2880-2900 range, and cover your positions every 2% drop, with the total position not exceeding 30%. If the price rebounds to 2980-3000, you can consider reducing some of your profit-making chips to reduce the cost of holding positions. Long-term holders: Ignore short-term fluctuations and focus on the staking yield (currently about 4.8% annualized). If you believe in the long-term value of Ethereum, the current price already has allocation value, but it is recommended to adopt a "fixed investment + pledge" combination strategy to smooth the risk of fluctuations. Behind every beating number on the disk is a collision of countless beliefs. When the price pierces the lower track of the Bollinger Bands and when MACD sends out a dazzling green signal, the market tells us in the coldest language: the cold winter is not over yet. But the real twists often happen where no one cares. Whales are still quietly staking, core developers are still building, and the Ethereum network is processing billions of dollars of value transfers every day—these fundamentals haven’t changed in response to the price drop. Markets look for bottoms in fear, and bottoms are often defined by those who remain rational while others panic. The question now is: do you wait for a lower price, or do you believe that 2915 ETH has reflected enough pessimistic expectations? Do you think ETH will stabilize above 2880, or will it continue to test 2800? Welcome to share your analysis and action plan in the comment area! Follow me to get the most timely technical analysis and on-chain data interpretation.  |

|

|

|

|

|