 English
44768
|
Solana’s price technical indicators show that the recent pullback to $100 is a buying opportunity on the dip, with traders looking for a path back to $260. SOL price may have bottomed near $100 on multiple time frames, a formation that is expected to help SOL price recover to $260 in the long term. Summary of key points:
SOL needs to break multiple resistance levels to hit $260SOL’s price action has prompted a possible “V-shaped” recovery pattern on the four-hour chart. Previously, SOL prices fell 25% from a high of $127, and only stopped falling after receiving buying support near the $100 support level. The relative strength index (RSI) indicator has rebounded from oversold 18 to 36 in the four-hour period, indicating upward momentum. The daily RSI indicator is in the oversold zone of 29, a level that has marked the market bottom many times before and helped SOL prices recover. Bullish forces hope to build a "V-shaped" bottom, but the current recovery path faces key resistance, including the $113 to $115 supply area, where multiple trend lines converge. The second area of concern is the $125 to $130 supply zone, defined by the 50-day exponential moving average (EMA) and the 50-day simple moving average (SMA) respectively. 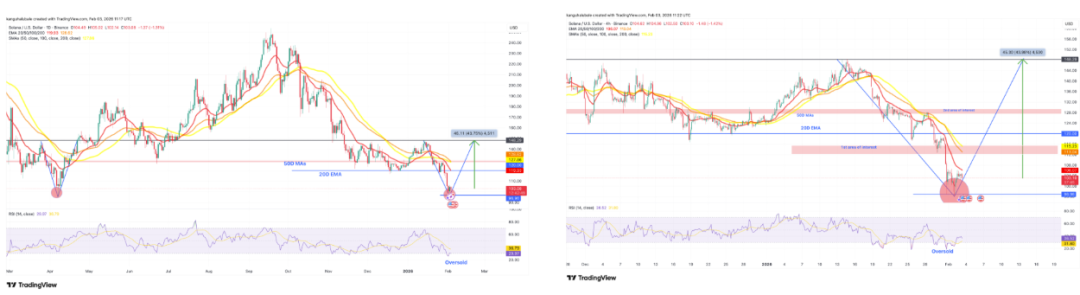 If it can break through the above resistance, SOL/USD is expected to further impact the neckline area of the pattern, which is the $150 supply area, and will rise 44% from the current price. Looking at the longer term, the weekly chart shows SOL finding strong support in the $95 to $100 range, as shown below. The last time it rebounded from this level, the SOL price surged 166% from $95 to $250 from April 2025 to September 2025. If a similar situation recurs, SOL's current recovery is expected to rise to $260 in the coming weeks or months, an increase of 150% from current levels. 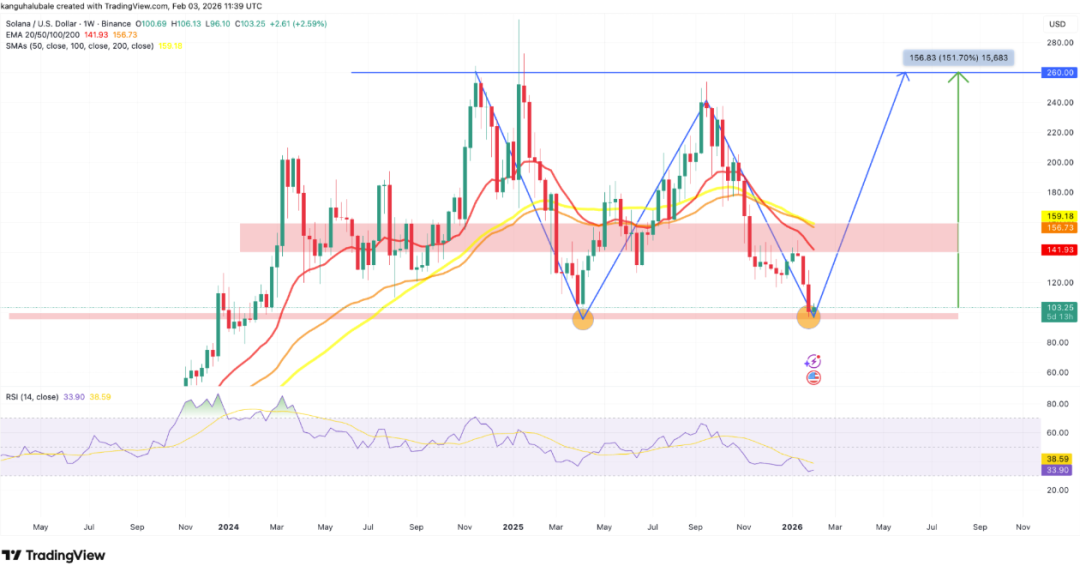 The 50-week moving average is in the $140 to $160 range, an area that has historically suppressed price rallies many times. Trader Tardigrade believes that SOL is expected to rise to the upper edge of $215 after rebounding from the lower edge of the descending channel. 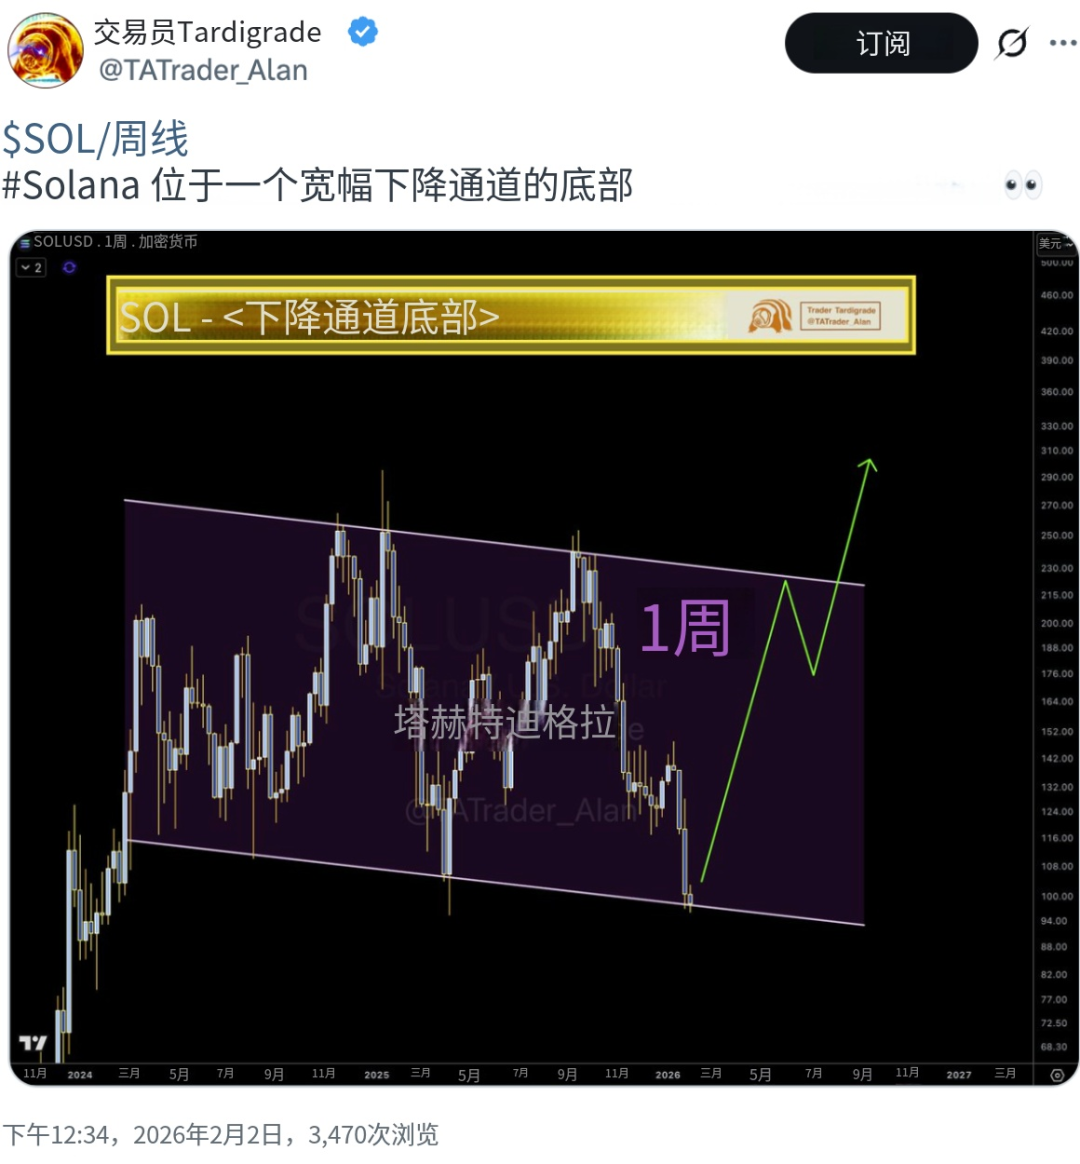 According to Cointelegraph, if the 20-day EMA indicator returns to support at $106, the SOL price may further rebound to the range of $120 to $150. Solana TVL and online activity continue to increaseSolana’s main decentralized application (DApp) indicator has shown strong momentum since mid-January. The network’s total value locked (TVL), which reflects the number of crypto assets injected into its smart contracts, hit an all-time high on Monday, reaching 73.4 million SOL, which is approximately $7.5 billion at current prices. It rose 18% in the past week. 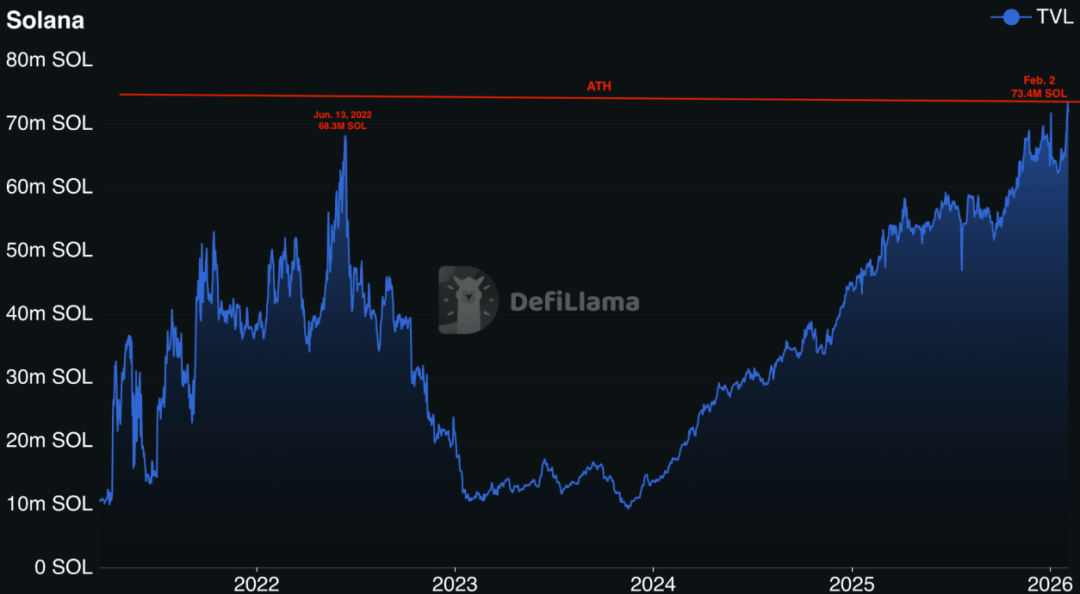 The last time this indicator hit a daily high was in June 2022, when TVL reached a maximum of 68.3 million SOL. At that time, it benefited from the 2021 Solana NFT craze and increased network activity. During the same period, SOL prices increased by 80% from June to August. In addition, Solana’s single-day on-chain transactions hit a two-year high on Monday, reaching 109.5 million. 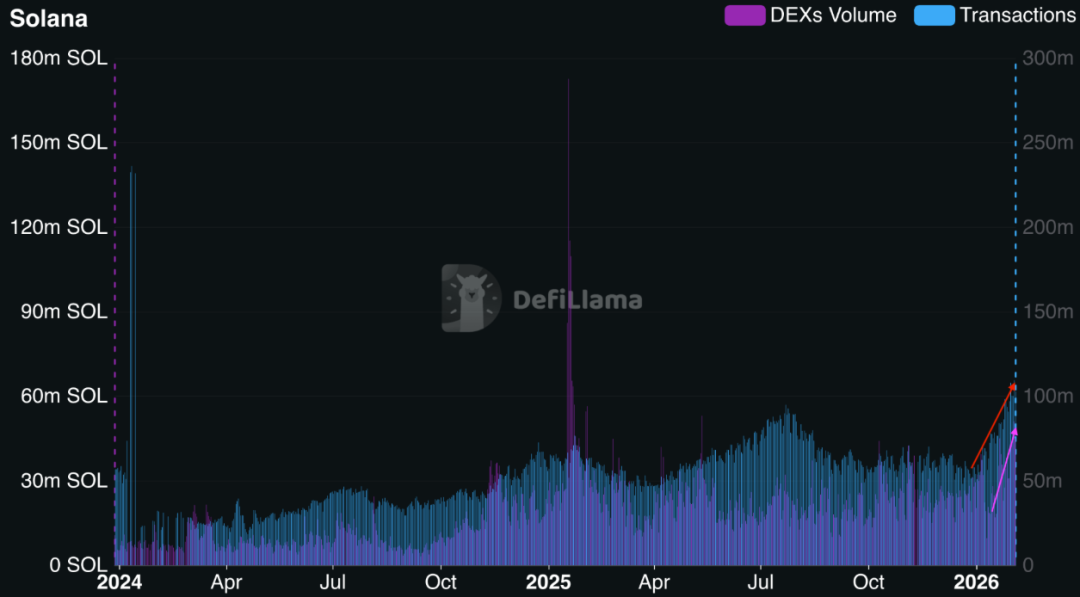 Single-day DEX trading volume also reached an eight-month high on Monday, reaching 51.3 million SOL, and weekly DEX trading volume hit a 12-month high in the week ending Sunday, reaching 264.8 million SOL. According to Cointelegraph, in the second half of January, Solana’s active addresses increased by 115% daily. Historically, the performance of this indicator usually indicates a subsequent bullish rise in the price of SOL. This article is for information sharing only and does not constitute promotion or endorsement of any business or investment behavior. Readers are requested to strictly abide by the laws and regulations of their region and refrain from participating in any illegal financial activities. |

|

|

|

|

|