
 English
31796
|
It is now 5:31 on February 5, 2026, East Eighth District time SOL price: 92USDT The crypto market has started another downward trend, looking for a bottom. Let’s look at the weekly chart today: 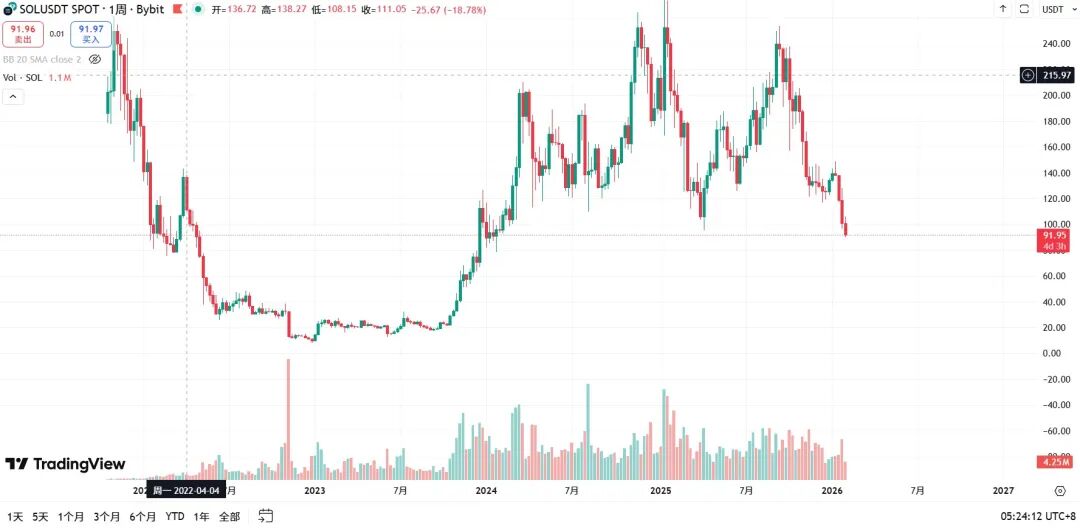 The current position is in a historical relay range of SOL (80~110USDT). According to market inertia, it will stay here for a period of time, probably one or two months. But this range will be lower than the historical range. After referring to ETH and BTC, I found that SOL is about to touch the bottom support level of this range, but ETH and BTC have just touched the top of the range, so the next week should still be dominated by a downward trend. The lowest level of 95u formed in April 2025 has just been broken by this weekly K. If long positions are sold out, it will also cause a certain stampede and crowding. To sum up, at the weekly k-level analysis, the price fell to the intermediate range, but combined with the overall market conditions, it will break out of a new market and create a new low in the range. From the daily chart: 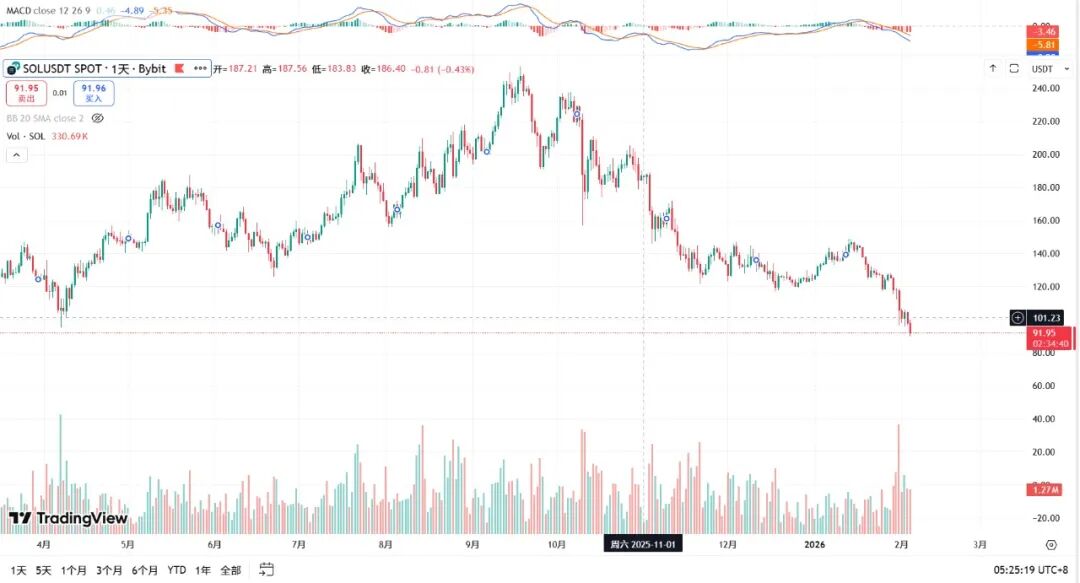 The third K-line from the bottom clearly shows a green K rising buy at the previous low. Combined with the volume and price fluctuations of buying orders, it is obviously not as strong as the first or two K-lines from the bottom, and it effectively breaks through, indicating that there is little confidence in the rise and strong selling. It is inferred that if the trading scale continues, it will directly hit a new low in the range under this wave of market conditions, start a certain rebound, and continue to fluctuate and fall. Reminder: There is a high probability that the rebound will not reach the historical heights of the previous two times. The reason is that ① ETH and BTC have not rebounded high in the historical range. ② After the market hits a new low, the rebound intensity will be even lower even if it is the same. Analysis from the hourly perspective: 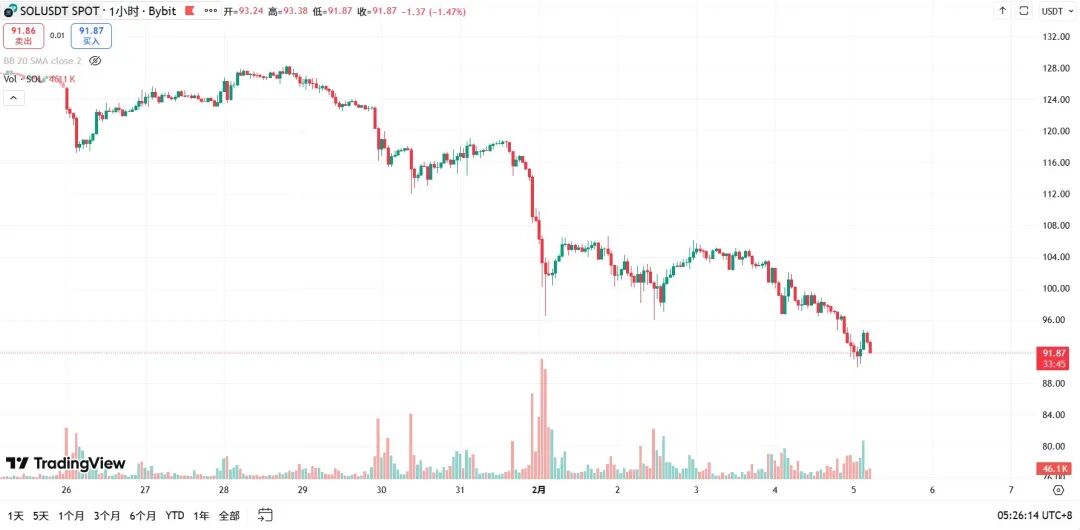 When it reached the resistance level, it rebounded on a small scale and increased its volume. Some buying orders appeared, some of which were shipments, and some of which were buying. Obviously, certain conditions were created for the short sellers, who continued to decline in heavy volume. 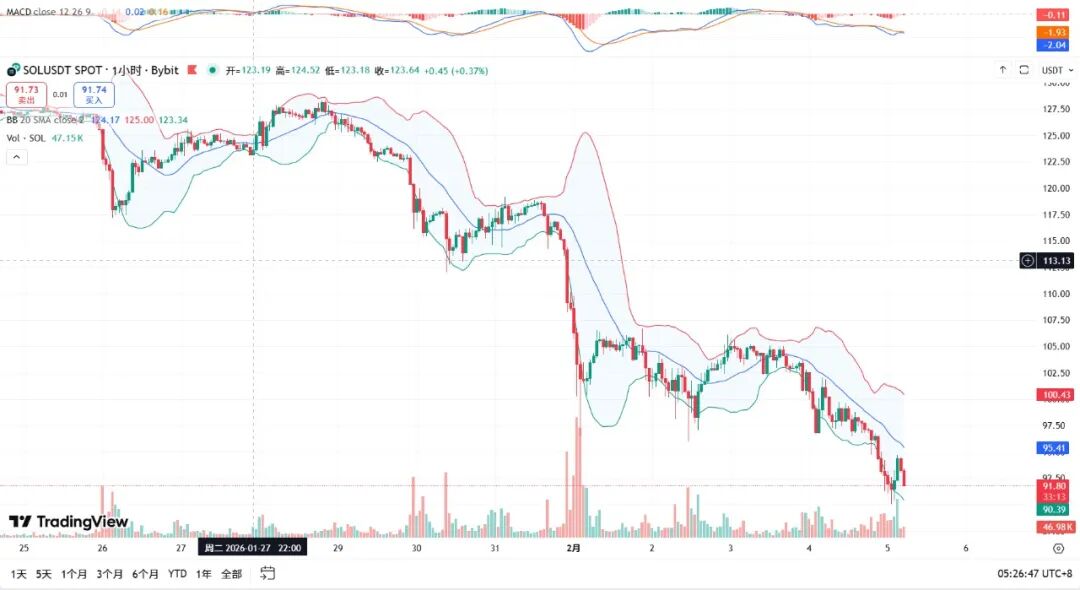 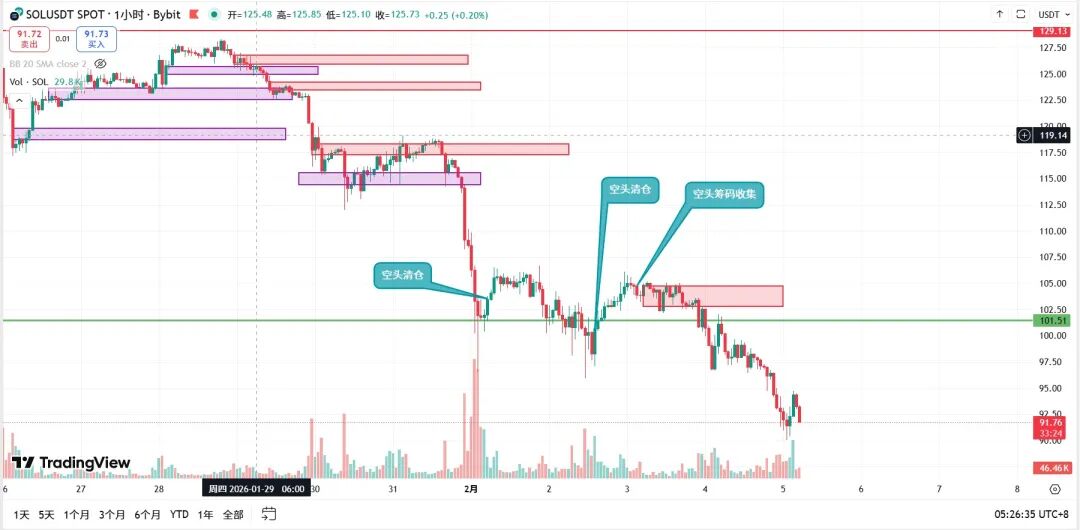 Trading time: short term: going long after the next rebound at the key level is expected to be around 84u Short: Short to 74u after rebound Hesitate when the market goes sideways and place your chips when the transaction volume shrinks. The above does not constitute any investment advice. The market is risky and investments must be made with caution. |

|

|

|

|

|