
 English
77726
 This column is dedicated to providing high-quality Web3 articles. You can scroll to the end of the article and continue to follow us👇 Recently, the price movement of XRP has attracted widespread attention in the market. Its price has fallen below the key support level of $3, which has made the market full of worries and speculation about its subsequent price direction. After experiencing a boom period in November 2024, XRP has tried to break through the $3 level many times, but each time it ended in a false breakthrough, and then ushered in a deeper price correction. Currently, XRP is facing a serious situation. Looking at market data, the short liquidation pool of over $500 million is between $2.89 and $2.73. This means that if XRP fails to successfully reclaim the $3 support level, it is most likely at risk of a sharp sell-off. Once the price falls below $3 and continues to decline, the funds in these short liquidation pools may trigger a chain reaction in the market, further driving the price of XRP down. From a market trading perspective, prices falling below key support levels often trigger panic among investors. When investors see that the price cannot maintain above important psychological levels, they may choose to sell their XRP holdings to avoid further losses. This selling behavior increases supply in the market, putting more pressure on prices. In the current market environment, investor confidence is crucial to the stability of XRP prices. If negative sentiment in the market continues to spread and investors become pessimistic about XRP’s prospects, they may reduce their investment in XRP or even exit the market entirely. This will cause demand for XRP to drop and the price to fall further. Price correction predicted by XRP chart fractalsFrom a technical analysis perspective, XRP’s price action is exhibiting a bearish fractal, which could trigger a price decline in the coming days. Looking back at September, the price of XRP formed a dome pattern, then entered a symmetrical triangle consolidation period, and finally fell sharply to the $2.70 area. In October, a similar situation happened again. 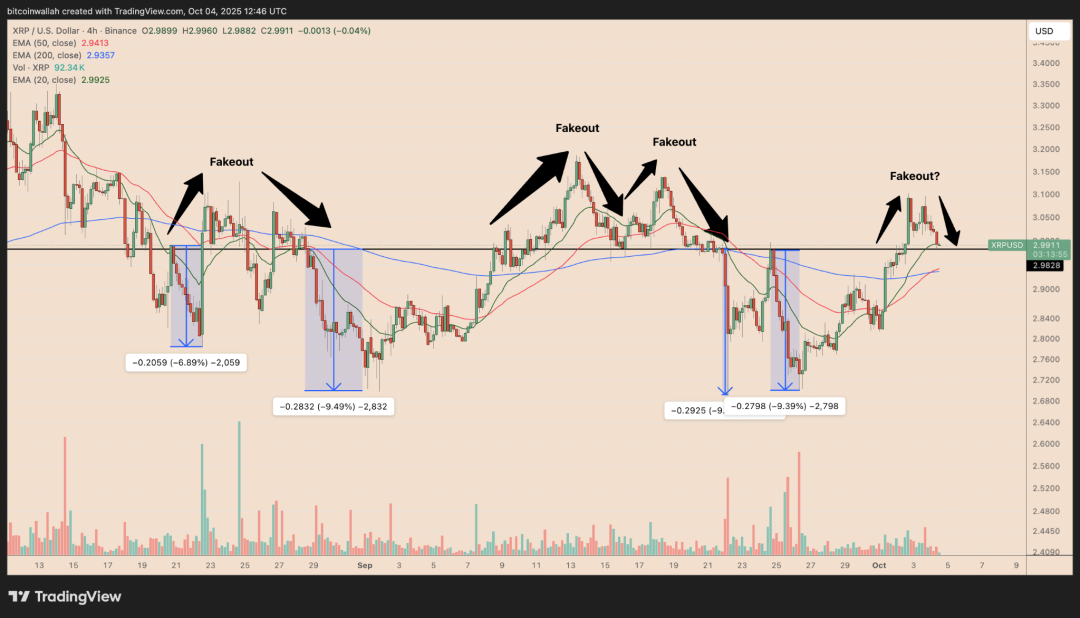 On the four-hour chart, XRP has formed another top and is consolidating within a bearish flag pattern. This pattern structure usually signals further price declines, possibly as much as the distance between its upper and lower trend lines. Meanwhile, the four-hour relative strength indicator (RSI) also points to the risk of a price decline. Currently, the RSI has been correcting from overbought levels above 70 and still has room to fall before reaching the oversold threshold of 30. Specifically, XRP may first test the flag support at $2.93. If the price is able to stabilize above this support, it may temporarily ease the downward pressure. But if the price decisively closes below $2.93, this would confirm a price breakdown, potentially opening the way for a drop to $2.60, a drop of nearly 15% from current prices. This downside target is consistent with XRP’s 200-day moving average (shown as a blue wave on the daily chart). However, the market is not entirely without improvement. If XRP price is able to rebound from the 20-day ($2.93) or 50-day EMA ($2.52), the bearish outlook may be invalidated and the price may rebound to $3 again. This requires some positive factors in the market, such as the stimulation of good news and the restoration of investor confidence. Judging from historical data, prices tend to rebound to a certain extent when encountering important moving average support. This is because the moving average represents the average cost of the market. When the price is close to or falls below the moving average, some investors will think that the price is already at a relatively reasonable level and choose to buy, pushing the price to rebound. Huge long liquidations fuel XRP sell-offAccording to data resource CoinGlass, XRP’s $3 level sits squarely between two large pockets of liquidity. On the upside, there is thick long liquidation level between $3.18 and $3.40. For example, at $3.18, the cumulative short leverage was approximately $33.81 million. This suggests that if the bulls are able to regain control, the market may move upward to trigger stop-loss orders, driving the price higher. However, the current market focus is more on the risk of price declines. On the downside, the liquidation heat map shows a larger liquidation pool between $2.89 and $2.73, with funds in excess of $500 million. If XRP achieves a decisive close below $3, this could trigger a cascade of long liquidations, causing the price to fall further into the $2.89 to $2.73 range. From the perspective of market capital flow, long liquidation means that investors are forced to close their positions, which will increase the supply in the market. When a large number of long positions are liquidated, there will be a lot of selling in the market, which will put huge pressure on the price. In this case, prices may fall rapidly, or even trigger panic selling in the market. If XRP can hold above $3, then the market leaves room for a stop loss to $3.20 to $3.40. This requires bulls to be able to muster enough power to push the price higher and break through key resistance levels. But in the current market environment, bulls face huge challenges. On the one hand, negative sentiment in the market may inhibit investors’ willingness to buy ; On the other hand, the long liquidation level above will also create some resistance to the price increase. After XRP fell below $3, its price action was filled with uncertainty. Judging by the chart fractals and market clearing, there is a risk of further price declines. However, market conditions are complex and changeable, and prices may rebound after encountering key support levels. Investors need to pay close attention to market dynamics and promptly adjust their investment strategies according to market changes to cope with possible risks and opportunities. In the investment decision-making process, investors should consider various factors comprehensively. In addition to technical analysis and market clearing data, one should also pay attention to the impact of macroeconomic environment, industry policies and other factors on XRP prices. For example, changes in the global economic situation, overall trends in the cryptocurrency market, adjustments in regulatory policies, etc. may have an important impact on the price of XRP. Investors should also pay attention to risk management. When investing in XRP, you should control your positions reasonably and avoid over-investment. At the same time, diversified investment strategies can be adopted to spread funds into different asset classes to reduce investment risks. From the long-term development of the market, XRP's price trend is also affected by its own fundamental factors. For example, XRP's technological development, expansion of application scenarios, and team's operational capabilities will all have an important impact on its future value. If XRP can continue to innovate in technology, expand more application scenarios, and improve its competitiveness in the market, then its price is expected to be supported in the future. The development of the XRP market is also closely related to changes in the global financial system. With the advent of the digital era, the financial industry is also constantly undergoing innovation and change. As a digital asset, XRP may play a more important role in the future financial system. This also provides investors with more room for imagination and investment opportunities. XRP’s price action after falling below $3 is full of variables. Investors need to fully understand the market conditions and make investment decisions carefully. In this ever-changing market, only by continuous learning and progress can we obtain better returns from investment. In short, the price trend of XRP after falling below $3 is an issue worthy of investors' close attention. Through the analysis and research of various factors, investors can better grasp market trends and make wise investment decisions. In this market full of challenges and opportunities, only continuous learning and progress can lead to success in investment. END About KnowHere Get more information Official website: https://www.knowhere.io Twitter:https://twitter.com/knowhere_io Discord: http://discord.gg/knowhereio Youtube:https://www.youtube.com/@knowhere_io Telegram::t.me/knowhere_official As a leading Web3.0 media platform, KnowHere is committed to promoting high-quality Web3.0 content Contact us  |

|

|

|

|

|